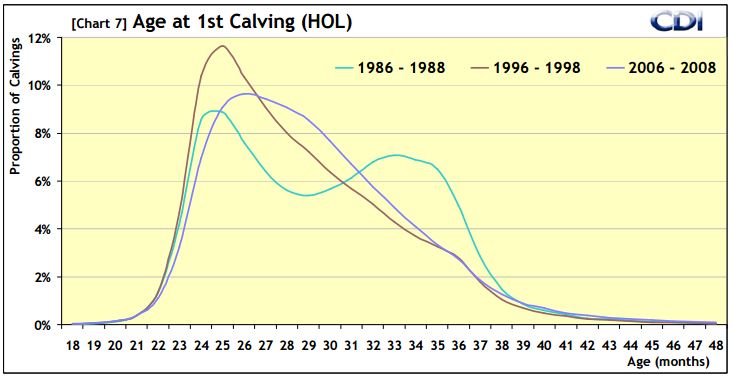
Calving Patterns 1986-2008
Merging the patterns together from all three periods perhaps shows best, just how much the national herd’s Age at First Calving has shifted over 20 years. The pale blue line shows the 1980’s pattern, with its twin peaks. The brown line depicts the mid- 1990’s with the much more pronounced peak at just over two years. While the midblue line indicates today’s picture, with a slightly later, but much more sustained peak.